Top BI Tools in 2024
Which BI tool best suits your business in 2024?
Table of Contents:
Introduction
Top BI Tools in 2024
. Tableau
. Power BI
. Looker
. Knowi
. Sigma Computing
Top BI Tools in 2024- Final Thoughts
Introduction
Business Intelligence (BI) helps businesses collect, analyze, and present data to obtain actionable insights for business growth. The global BI market is predicted to grow to $33.3 billion by 2025. Business Intelligence Stats for 2021 indicate that BI tools are now so important that almost every business leader wants to implement them. Currently, more than 46% of businesses are already using a BI tool as a core part of their business strategy. In this article, we have compiled a list of the top BI tools in 2024.
Top BI Tools in 2024
The following are the best business intelligence tools for 2024, with different levels of robustness, accessibility, interoperability, and cost.
Tableau

Tableau is a data visualization tool used by enterprises for business intelligence. It was launched in 2003 and acquired by Salesforce in 2019. Tableau has the largest user base of all BI tools in the market. Tableau users can create a wide range of visualizations from their data to showcase insights. It offers advanced features for drilling down into data and presenting the findings in a visual format that can be understood by all users. It is also a good BI tool for real-time data analytics.
The following are the key features of Tableau:
Visualizations
Tableau is well-known globally for its ability to generate beautiful and powerful visualizations. Users can create amazing graphs, charts, maps, dashboards, and stories that can be customized to meet specific user needs.
Supported data sources
Tableau comes with native connectors to SQL-based data sources. For no-SQL data sources, Tableau users can use third-party ODBC drivers/connectors (such as Progress, CData, etc.) that can translate into SQL.
Multi-source joins
Tableau supports different join operations for joining data across different data sources. These join operations include INNER JOIN, LEFT OUTER JOIN, FULL OUTER JOIN, and RIGHT OUTER JOIN.

For the join operations to run, there must be a common field across the data sources.
Analytics
Tableau is a powerful tool for advanced data analytics. It has the Ask Data feature that lets non-technical users type questions in a natural language such as English and Tableau returns a response.
Embedded Analytics
Tableau generates a simple HTML embed code that can be used to embed dashboards and visualizations on web pages. It also enables users to embed their visual analytics into custom web portals, third-party applications, and custom-facing software and data products.
Alerts/Anomaly Detection
With Tableau, you can set up data-driven alerts on views and dashboards, but not on storyboards. The alerts are generated when certain thresholds are met, or when particular anomalies are detected in data, and are sent to your email.
Pricing
Tableau has three pricing plans namely Creator, Explorer, and Viewer. Tableau prices are quoted per user, per month, and billed annually.
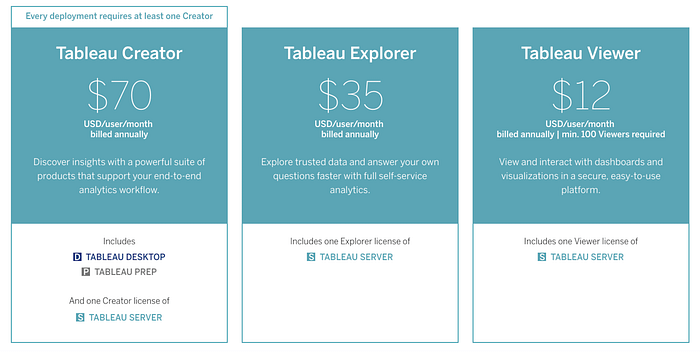
The Creator plan offers the full Tableau functionality and costs $70/user/month. The Explorer plan is fit for individual users who need to perform self-service analytics. It costs $35/user/month for on-premise deployment and $42user/month for cloud deployment. The Tableau Viewer plan only allows users to view already created dashboards and visualizations. It costs $12/user/month for on-premise deployment and $15/user/month for cloud deployment. Tableau has a 14-day trial period.
Power BI

Power BI is a Business Intelligence tool provided by Microsoft. It provides non-technical users with tools for aggregating, analyzing, visualizing, and sharing data. Power BI offers a fairly intuitive user interface for those familiar with Excel, with deep integration with Microsoft products. This makes it a versatile self-service BI tool that requires little upfront training. The tool was meant to move die-hard Excel users into a real business intelligence environment. Power BI was launched in 2015 as a stand-alone product. Before that, Microsoft had been bundling some of Power BI’s analytics and visualization features into Excel as an add-on. Power BI offers the following features:
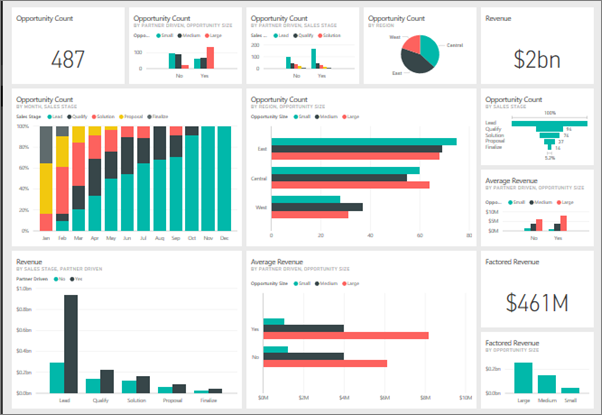
Visualizations
Power BI offers a plethora of data visualization options that you would expect from a Microsoft product. It has both standard and advanced visualizations. With Power BI, you can create custom visualizations and upload them on their App source marketplace.
Data Sources
Just like Tableau, Power BI can connect to any structured or SQL-based data source. However, you must use third-party connectors such as ODBC (Open Database Connectivity) that translate into SQL to connect to No-SQL data sources. Alternatively, Power BI users can use ETL processes to move their data into an SQL-based data warehouse and apply schema.
Analytics
Power BI provides good analytics capabilities for both beginner and advanced users. It also has a natural language query for performing analytics with conversational questions.
Embedded Analytics
Power BI has an embedded analytics feature that lets you embed your Power BI items such as reports, tiles, and dashboards in your web applications. Its secure embed feature is the simplest no-code way of embedding a report into any portal that accepts iFrame or URL.
Alerts/Anomaly Detection
You can set alerts in Power BI to receive notifications when data on a dashboard changes below or above the limits that you set. The alerts are sent to your Notification center within Power BI or optionally, to your email.
Pricing
Power BI starts from a low price point but the price shoots up as you scale up the license and add-ons. It has two pricing plans starting from $9.99 to $4,995, that is, Power BI Pro and Power BI Premium.
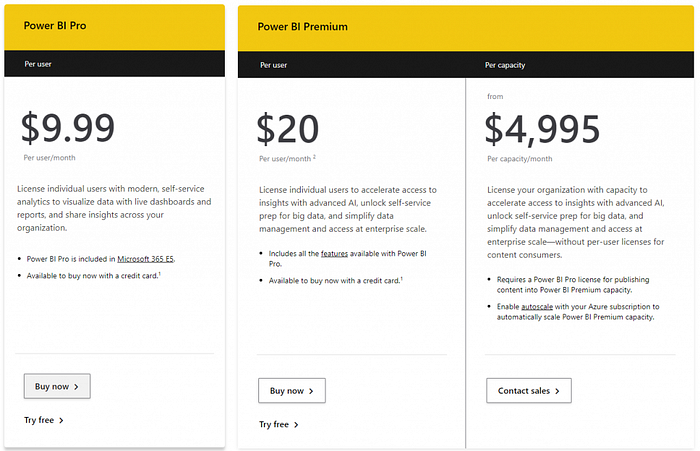
Power BI Pro is good for individual users and it costs $9.99 per user/per month. Power BI Premium is good for both individual users and enterprises. It costs $20.00 per user/per month or $4,995.00 per capacity/per month.
Looker
Looker is a data analytics platform that enables small and large organizations to extract insights from their data. It is a good platform for data applications, business intelligence, and embedded analytics. Looker delivers actionable business insights at the point of decision and infuses data into workflows and products to move the business forward. The platform was launched in 2011 and acquired by Google in 2019. Looker is a browser-based BI tool and has a unique modeling language, LookML. It has a wide variety of interactive charts and graphs for data visualization. Looker integrates with databases and big data platforms. It has a link-sharing feature that lets teams collaborate on a project.
The Looker BI tool offers the following key features:
Visualizations
Looker offers a wide variety of visualization options for presenting data. Examples of such visualizations include maps, cartesian charts, tables, pie and donut charts, and texts. Each visualization has unique settings that can be used to customize their looks.
Data Integration
Looker integrates well with SQL-based data sources. However, to analyze data stored in NoSQL, files, REST APIs, etc., you must first put the data in some form of an SQL database for Looker to query against.
Analytics
Although Looker doesn’t have natural language processing capabilities, it has analytics code blocks, that is, Looker Blocks, with data models, SQL patterns, and visualizations included. You can customize the blocks to meet your individual needs.
Embedded Analytics
Looker’s Powered By Looker (PBL) feature enables it to offer its full functionality as an external service. Users can embed sophisticated analytics directly into their websites or applications.
Alerts/Notifications
Looker has an alerts/notifications feature that lets you specify conditions in your data that when met will trigger notifications. The notifications are sent to the specified recipients at the specified frequency via Slack or email.
Pricing
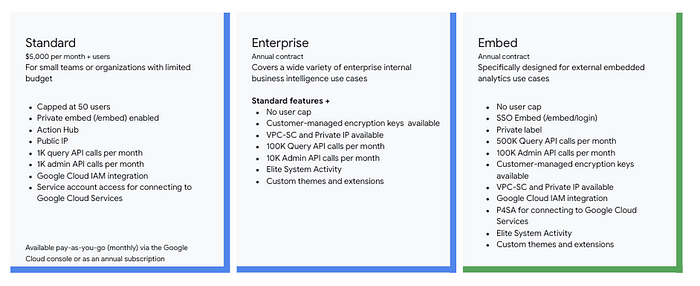
Looker has not made its pricing information public. It offers a customized approach by which it creates a suitable pricing structure based on your business needs. You can click the “Request a quote” button on their website to get a price quote for Looker multi-cloud options, Looker Embedded, Looker Modeler, or Looker Studio Pro. Looker (Google Cloud Core) has four pricing plans namely Standard (monthly subscription), Standard (annual), Enterprise (annual), and Embed (annual). The Standard (monthly subscription) plan costs $5,000/month. You can contact the sales team for pricing information about the other plans.
Knowi
Knowi is a unified data analytics platform all the way from the data source to the alerts that drive action in your business. It was launched in 2015, and today it offers BI services to big enterprises across the world. Knowi uses a data virtualization feature to save its users from taking their data through cumbersome and time-consuming ETL processes. This makes it a unique tool in the BI market. Knowi supports native integration with NoSQL data sources, allowing users to analyze unstructured data directly, a feature not offered by traditional BI tools.
The following are the key features of Knowi:
Visualizations
Knowi can be used to create customizable visualizations and dashboards. It offers more than 30 visualizations that can be used to present data visually. Its Presenter Mode feature lets users present display charts and plain English insights next to each other. Knowi users can also create custom visualizations with JavaScript to meet their specific needs.
Data-as-a-Service
Knowi offers direct access to any data, anywhere. It allows users to blend data across multiple sources, on the fly, including munging structured and unstructured data. The query results can be stored in Knowi, thereby reducing the cost of data warehouses like Snowflake. Resulting queries can also be put into a new table within Snowflake or Redshift (DBWrite). It supports integration with more than 36 structured and unstructured data sources such as Apache Cassandra, Elasticsearch, MongoDB, and others. Unlike other BI tools, Knowi has native connectors to NoSQL data sources, relieving you from the need to use third-party drivers.
Knowi is also fully native, hence, you don’t have to “relationalize” the data.
Analytics
Knowi comes with a search-driven analytics feature powered by natural language processing. You can ask questions directly from Slack, Microsoft Teams, or within Knowi in plain English and get immediate results. Knowi has also integrated with ChatGPT and OpenAI to make querying and presenting real-world context on dashboards much easier. It has a Query Assist feature that generates appropriate queries in the right dialect from plain English. Recently, Knowi has also introduced the InstantSights feature that summarizes your dataset in plain English, with predictions, summaries, Top/Bottom N, etc.
Multi-source Joins
Knowi users can join data across disparate data sources without having to ETL. The join operations are based on a common field among the data sources. It supports various join operations including INNER JOIN, LEFT OUTER JOIN, FULL OUTER JOIN, RIGHT OUTER JOIN, and LOOP JOIN. The INNER JOIN is used as the default join operation.
Knowi users can perform large-scale join operations across millions of records over multiple data sources. The joins can also be optimized for faster processing.
Embedded Analytics
You can embed your Knowi dashboards and visualizations on your own website or app and provide a huge value add to your customers. It offers various options for implementing embedded analytics. You can generate a URL of your dashboard and embed it in your external application. You can also create a secure URL that uses parameters to restrict the data that can be seen by users. Knowi also provides the Single SignOn API that facilitates token exchange from users in your system to map to Knowi with user rights and permissions. Knowi’s JavaScript Embed API provides fine-grained control over embedded data visualizations, their look and feel, and user access.
Alerts/Notifications
Knowi has an alert feature that updates you on important changes that occur to your data or business in a centralized location. This feature enhances data management by monitoring query execution and sending real-time notifications when certain conditions, anomalies, or thresholds are detected in your data. The alerts can also be set up directly on a widget based on an anomaly, threshold, or custom condition in the data. You can receive the alert notifications via webhook, email, or Slack.
Pricing
Knowi has not made its pricing information publicly available. Instead, you can fill out a form on their website to request pricing information. Knowi has three pricing plans namely Basic, Team, and Enterprise, each with full onboarding and technical support. It offers discounts for startups and non-profits. Knowi doesn’t charge for user reports that require a user etc. in other systems.
Sigma Computing
Sigma Computing is a business intelligence and cloud analytics solution built for the cloud. The platform was meant to increase the speed to insights by combining Snowflake’s lightning-fast computing power with an intuitive spreadsheet interface. Sigma users can use spreadsheet formulas and functions to explore live data at the cloud scale and extract the finest details. It offers a code-free and code-friendly environment for data manipulation and visualization, enabling users to slice and dice data in every possible way. The BI tool uses a spreadsheet-like interface to deliver the full power of SQL into the hands of its users while at the same time keeping data fresh and secure within cloud data warehouses.
Sigma Computing offers the following key features:
Integration with data sources
Sigma users can source data from a number of external data sources, including cloud data warehouses, Sigma datasets, uploaded CSVs, and written SQL. Although Sigma doesn’t have an extensive list of supported data sources, it allows more technical users to create custom plugins to source data from non-supported sources and visualize what they can code.
Visualizations
Sigma has a wide variety of chart options for data visualization such as bar, line, KPI, funnel box, scatter, combo, and others. The charts have various properties and formatting options that you can play around with to enhance your visualizations and ensure they present actionable and meaningful information.
Instantly familiar to users
Although Sigma doesn’t have natural language processing capabilities, it enables users to freely analyze their data using a familiar spreadsheet-like interface. They can work with billions of data rows without special training.
Multi-source Joins
Sigma users can join data between datasets or warehouse tables. It supports various join operations including INNER JOIN, LOOKUP JOIN, LEFT OUTER JOIN, FULL OUTER JOIN, and RIGHT OUTER JOIN.
The joins are done based on a common field among the data sources.
Embedded Analytics
Sigma comes with a workbook embedding feature that lets you display your workbooks and data elements in other internal and external facing applications. The embed data updates in real-time in response to changes in your data warehouse. Sigma offers three types of embedding: private, public, and application.
Public embeds can be viewed by anyone with the embed URL. Private embeds can be viewed by Sigma organization’s members who have been granted access to the workbook. You can use application embedding to embed your data securely without requiring users to authenticate through Sigma.
Alerts/Notifications
Sigma’s alerts/notifications feature sends conditional messages via Slack or Email based on KPIs or missing data. Sigma can also be scheduled to share workbooks, their pages, or individual elements via the same channels.
Pricing
Sigma has not made its pricing information available to the public. It has a customized pricing approach in which a suitable plan is created for you depending on your needs. Sigmas offers its users a 14-day free trial period.
Top BI Tools in 2024- Final Thoughts
Each BI tool on this list will take your data and turn it into something visually engaging for easier analysis. Your choice of the BI tool to use boils down to your organization’s size, budget, and must-have features vs. how experienced your team is with data analysis.
Tableau will make a good BI tool for an organization looking for a BI tool to generate beautiful visualizations and complex reports without the need to connect to complex, unstructured data sources. However, ensure that you can meet its budget.
Looker and Sigma are suitable for enterprises looking for a simple BI tool to generate simple and customizable visualizations. Their customizable pricing approach also makes them suitable for small and medium-sized enterprises. Sigma’s intuitive user interface makes it usable by users of all skill levels.
Power BI is a suitable BI tool for an enterprise whose focus is on the price point and its team is not going to scale up much in the future or does not need the premium options.
If your goal is to have a BI tool that offers a flexible pricing structure and can work with any data, anywhere, choose Knowi. It will also save you from incurring data warehouse costs.